
This set of MCQ(multiple choice questions) focuses on the Introduction to Machine Learning NPTEL Week 3 Solutions NPTEL 2023.
With the increased availability of data from varied sources there has been increasing attention paid to the various data driven disciplines such as analytics and machine learning. In this course we intend to introduce some of the basic concepts of machine learning from a mathematically well motivated perspective. We will cover the different learning paradigms and some of the more popular algorithms and architectures used in each of these paradigms.
Course layout
Answers COMING SOON! Kindly Wait!
Week 1: Assignment answers
Week 2: Assignment answers
Week 3: Assignment answers
Week 4: Assignment answers
Week 5: Assignment answers
Week 6: Assignment answers
Week 7: Assignment answers
Week 8: Assignment answers
Week 9: Assignment answers
Week 10: Assignment answers
Week 11: Assignment answers
Week 12: Assignment answers
NOTE: You can check your answer immediately by clicking show answer button. Introduction to Machine Learning NPTEL Week 3 Solutions Assignment Solution” contains 10 questions.
Now, start attempting the quiz.
Introduction to Machine learning NPTEL 2023 Week 3 Solutions
Q1. Fill in the blanks:
K-Nearest Neighbor is a _______, ________ algorithm
a) Non-parametric, eager
b) Parametric, eager
c) Non-parametric, lazy
d) Parametric, lazy
Answer: c)
Q2. You have been given the following 2 statements. Find out which of these options is/are true in the case of k-NN.
(i) In case of very large value of k, we may include points from other classes in to the neighborhood.
(ii) In case of too small value of k, the algorithm is very sensitive to noise.
a) (i) is True and (ii) is False
b) (i) is False and (ii) is True
c) Both are True
d) Both are False
Answer: c)
Q3. State whether the statement is True/False:
k-NN algorithm does more computation on test time rather than train time.
a) True
b) False
Answer: a)
Q4. Suppose you are given the following images(1 represents the left image, 2 represents the middle and 3 represents the right). Now you task is to find out the value of k in k-NN in each of the images shown below. Here k1 is for 1st, k2 is for 2nd and k3 is for 3rd figure.
a) k1 > k2 > k3
b) k1 < k2 > k3
c) k1 < k2 < k3
d) None of these
Answer: c)
Q5. Which of the following necessitates feature reduction in machine learning?
a) Irrelevant and redundant features
b) Limited training data
c) Limited computational resources
d) All of the above
Answer: d)
Q6.Suppose, you have given the following data where x and y are the 2 input variables and Class is the dependent variable.
a) + Class
b) – Class
c) Can’t say
d) None of these
Answer: a)
Q7. What is the optimum number of principal components in the below figure?
a) 10
b) 20
c) 30
d) 40
Answer: c)
Q8. Suppose we are using dimensionality reduction as pre-processing technique, i.e, instead of using all the features, we reduce the data to k dimensions with PCA. And then use these PCA projections as our features. Which of the following statements is correct?
Choose which of the options is correct?
a) Higher value of ‘k’ means more regularization
b) Higher value of ‘k’ means less regularization
Answer: b)
Q9. In collaborative filtering-based recommendation, the items are recommended based on:
a) Similar users
b) Similar items
c) Both of the above
d) None of the above
Answer: a)
Q10. The major limitation of collaborative filtering is:
a) Cold start
b) Overspecialization
c) None of the above
Answer: a)
Q11. Consider the figures below. Which figure shows the most probable PCA component directions for the data points?
a) A
b) B
c) C
d) D
Answer: a)
Q12. Suppose that you wish to reduce the number of dimensions of a given data to dimensions using PCA. Which of the following statement is correct?
a) Higher means more regularization
b) Higher means less regularization
c) Can’t say
Answer: b)
Q13. Suppose you are given 7 plots 1-7 (left to right) and you want to compare Pearson correlation coefficients between variables of each plot. Which fo the following is true?
1. 1 < 2<3<4
2. 1>2>3>4
3. 7<6<5<4
4. 7>6>5>4
a) 1 and 3
b) 2 and 3
c) 1 and 4
d) 2 and 4
Answer: b)
Q14. Imagine you are dealing with 20 class classification problem. What is the maximum number of discriminant vectors that can be produced by LDA?
a) 20
b) 19
c) 21
d) 10
Answer: b)
Q15. In which of the following situations collaborative filtering algorithm is appropriate?
a) You manage an online bookstore and you have the book ratins from many users. For each user, you want to recommend other books he/she will like based on her previous ratins and other users’ ratings.
b) You manage an online bookstore and you have the book raings from many users. You want to predict the expected sales volume(No of books sold) as a function of average rating of a book.
c) Both A and B
d) None of the above
Answer: a)
Introduction to Machine learning NPTEL 2023 Week 3 Solutions
Q1. Which of the following is false about a logistic regression based classifier?
a) The logistic function is non-linear in the weights
b) The logistic function is linear in the weights
c) he decision boundary is non-linear in the weights
d) The decision boundary is linear in the weights
Answer: a,c
Q2. Consider the case where two classes follow Gaussian distribution which are centered at (3, 9) and (−3, 3) and have identity covariance matrix. Which of the following is the separating decision boundary using LDA assuming the priors to be equal?
a) y−x=3
b) x+y=3
c) x+y=6
d) both (b) and (c)
e) None of the above
f) Can not be found from the given information
Answer: c
Q3. Consider the following relation between a dependent variable and an independent variable identified by doing simple linear regression. Which among the following relations between the two variables does the graph indicate?
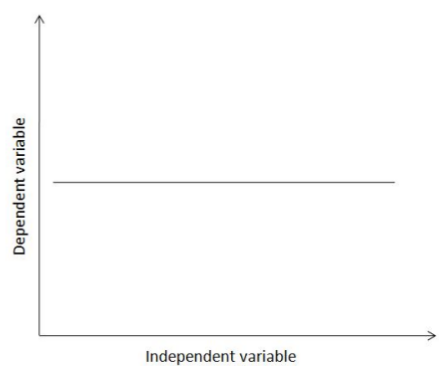
a) as the independent variable increases, so does the dependent variable
b) as the independent variable increases, the dependent variable decreases
c) if an increase in the value of the dependent variable is observed, then the independent variable will show a corresponding increase
d) if an increase in the value of the dependent variable is observed, then the independent variable will show a corresponding decrease
e) the dependent variable in this graph does not actually depend on the independent variable
f) none of the above
Answer: e
Q4. Given the following distribution of data points:
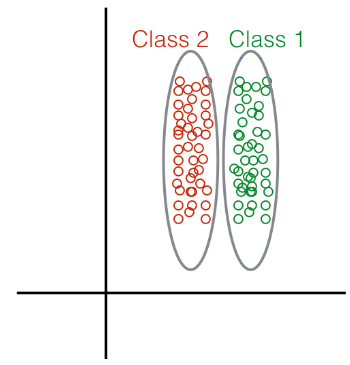
What method would you choose to perform Dimensionality Reduction?
a) Linear Discriminant Analysis
b) Principal Component Analysis
Answer: a
Q5. In general, which of the following classification methods is the most resistant to gross outliers?
a) Quadratic Discriminant Analysis (QDA)
b) Linear Regression
c) Logistic regression
d) Linear Discriminant Analysis (LDA)
Answer: c
Q6. Suppose that we have two variables, X and Y (the dependent variable). We wish to find the relation between them. An expert tells us that
relation between the two has the form Y=m+X2+c=+2+. Available to us are samples of the variables X and Y. Is it possible to apply linear regression to this data to estimate the values of m and c?
a) no
b) yes
c) insufficient information
Answer: b
Q7. In a binary classification scenario where x is the independent variable and y is the dependent variable, logistic regression assumes that the conditional distribution y|x| follows a
a) Bernoulli distribution
b) binomial distribution
c) normal distribution
d) exponential distribution
Answer: a
Q8. Consider the following data:
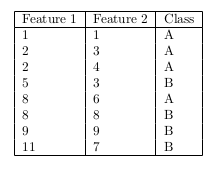
Assuming that you apply LDA to this data, what is the estimated covariance matrix?
a) [1.8750.31250.31250.9375][1.8750.31250.31250.9375]
b) [2.50.41670.41671.25]
c) [1.8750.31250.31251.2188]
d) [2.50.41670.41671.625]
e) [3.251.16671.16672.375]
f) [2.43750.8750.8751.7812]
g) None of these
Answer: g
Q9. Given the following 3D input data, identify the principal component.
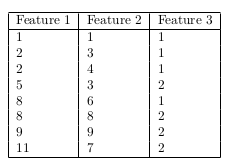
(Steps: center the data, calculate the sample covariance matrix, calculate the eigenvectors and eigenvalues, identify the principal component)
a) ⎢−0.10220.00180.9948⎤⎦⎥
b) ⎡⎣⎢0.5742−0.81640.0605⎤⎦⎥
c) ⎢0.57420.81640.0605⎤⎦⎥
d) ⎡⎣⎢−0.57420.81640.0605⎤⎦
e) ⎡⎣⎢0.81230.57740.0824⎤⎦⎥
f) None of the above
Answer: a
Q10. For the data given in the previous question, find the transformed input along the first two principal components.
a) ⎡⎣⎢⎢⎢⎢⎢⎢⎢⎢⎢⎢⎢⎢⎢⎢0.6100−0.4487−1.26511.33450.5474−1.0250−1.26721.5142−0.0196−0.1181−0.11630.5702−0.72570.27270.1724−0.0355⎤⎦⎥⎥⎥⎥⎥⎥⎥⎥⎥⎥⎥⎥⎥⎥
b) ⎡⎣⎢⎢⎢⎢⎢⎢⎢⎢⎢⎢⎢⎢⎢⎢−0.1817−1.2404−2.05680.5428−0.2443−1.8167−2.05890.72250.89440.79590.79771.48420.18841.18681.08640.8785⎤⎦⎥⎥⎥⎥⎥⎥⎥⎥⎥⎥⎥⎥⎥⎥
c) ⎡⎣⎢⎢⎢⎢⎢⎢⎢⎢⎢⎢⎢⎢⎢⎢−6.2814−4.3143−3.7368−1.79502.29173.52894.91865.38830.6100−0.4487−1.26511.33450.5474−1.0250−1.26721.5142⎤⎦⎥⎥⎥⎥⎥⎥⎥⎥⎥⎥⎥⎥⎥⎥
d) ⎡⎣⎢⎢⎢⎢⎢⎢⎢⎢⎢⎢⎢⎢⎢⎢1.47213.43924.01665.958410.045111.282312.672013.1418−0.1817−1.2404−2.05680.5428−0.2443−1.8167−2.05890.7225⎤⎦⎥⎥⎥⎥⎥⎥⎥⎥⎥⎥⎥⎥⎥⎥
e) None of the above
Answer: e
<< Previous- Introduction to Machine Learning Week 2 Assignment Solutions
>> Next- Introduction to Machine Learning Week 4 Assignment Solutions
DISCLAIMER: Use these answers only for the reference purpose. Quizermania doesn't claim these answers to be 100% correct. So, make sure you submit your assignments on the basis of your knowledge.For discussion about any question, join the below comment section. And get the solution of your query. Also, try to share your thoughts about the topics covered in this particular quiz.
Checkout for more NPTEL Courses: Click Here!